
A+ Setups Arsenal
Overview
-
The Flagship Trading Model
The CenterLine Method
-
Top/Bottom-Picker — an incredible tool to locate potential tops and bottoms in all asset classes and timeframes
-
Cumulative Delta — Know with absolute certainty which way market participants are leaning
-
S007 — Makes plotting a cluster of levels very easy
Volume Profile — Plot the prior day’s value area and plot other key levels automatically
Subscribe Now and Get Everything Free
The A+ Setups Flagship Model — All three setups. One unified system — Just released!
The Flagship Trading Model
The Jiggle
The most frequently occurring setup in the A+ Setups arsenal. The Jiggle targets shallow trend pullbacks with precise, rules-based entries backed by thousands of statistical observations. High frequency. Clear signals. No ambiguity.
Works on all actively traded futures markets and stocks.
Key Features
Developed for NinjaTrader
All three setups under one roof:
Shallow pullback: The Jiggle
Deep pullback: The Reverse Mullet
Deepest pullback: The Puncture Trade
A statistics panel with time filtering options and ability to adjust Take Profit and Stop Loss levels
A Setup Status panel to visually alert you to which setup is currently underway
Selectable filtering for each setup
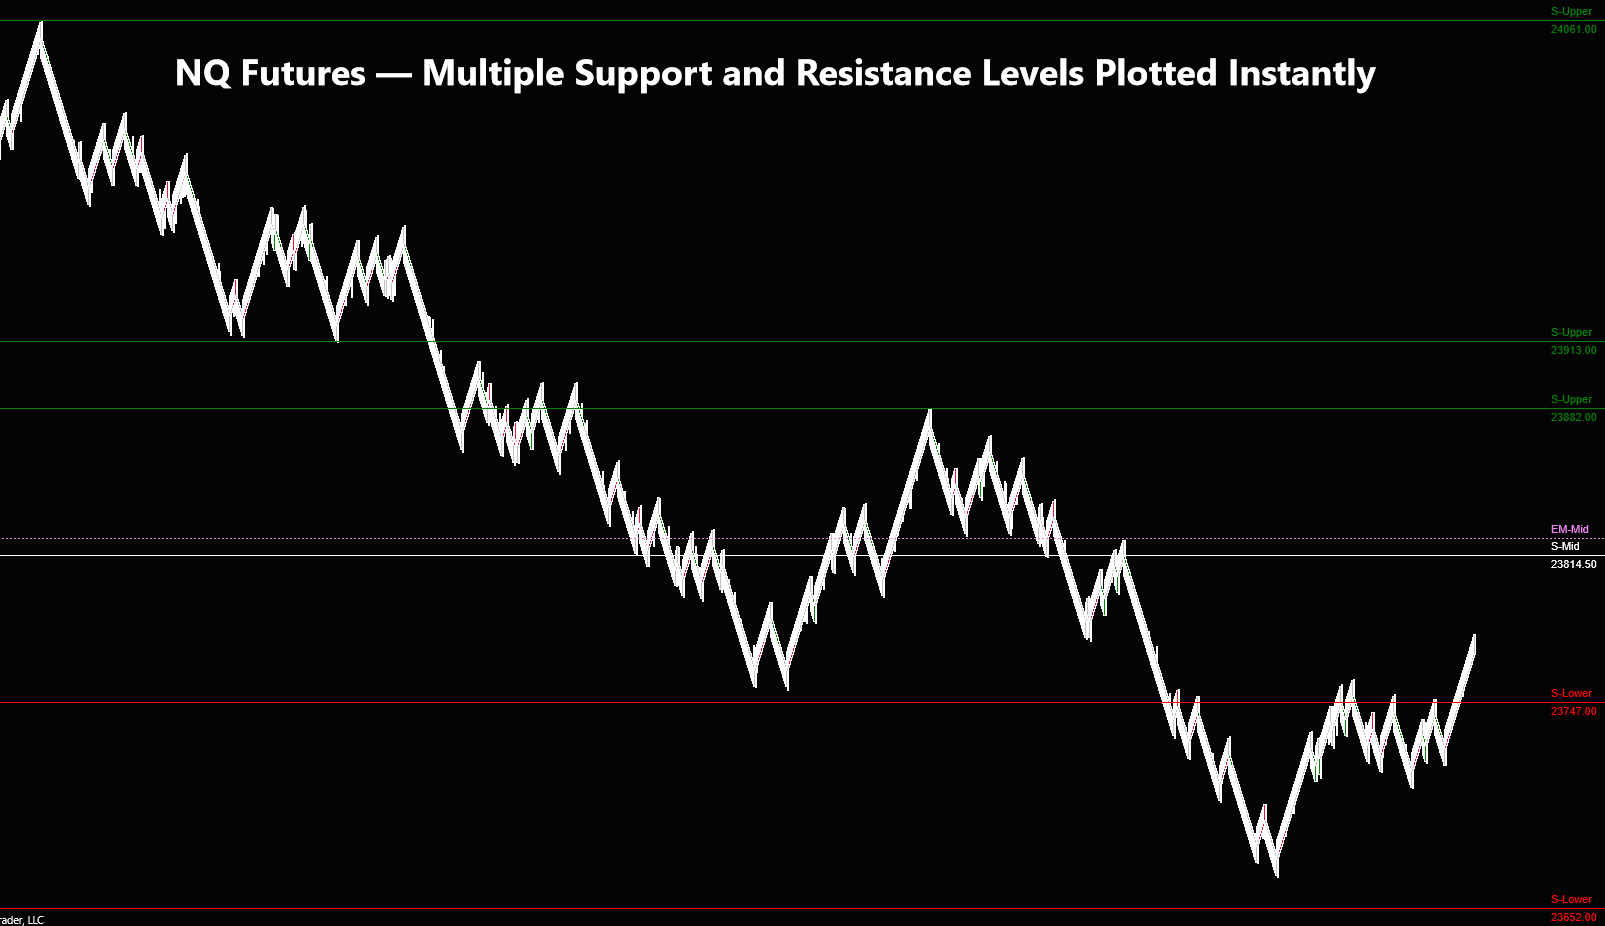
S-Levels plots multiple support and resistance levels on your chart instantly — no manual input required. Simply copy and paste values and the indicator handles the rest.
Note — S-Levels does not generate levels automatically. It plots levels you provide, quickly and cleanly.
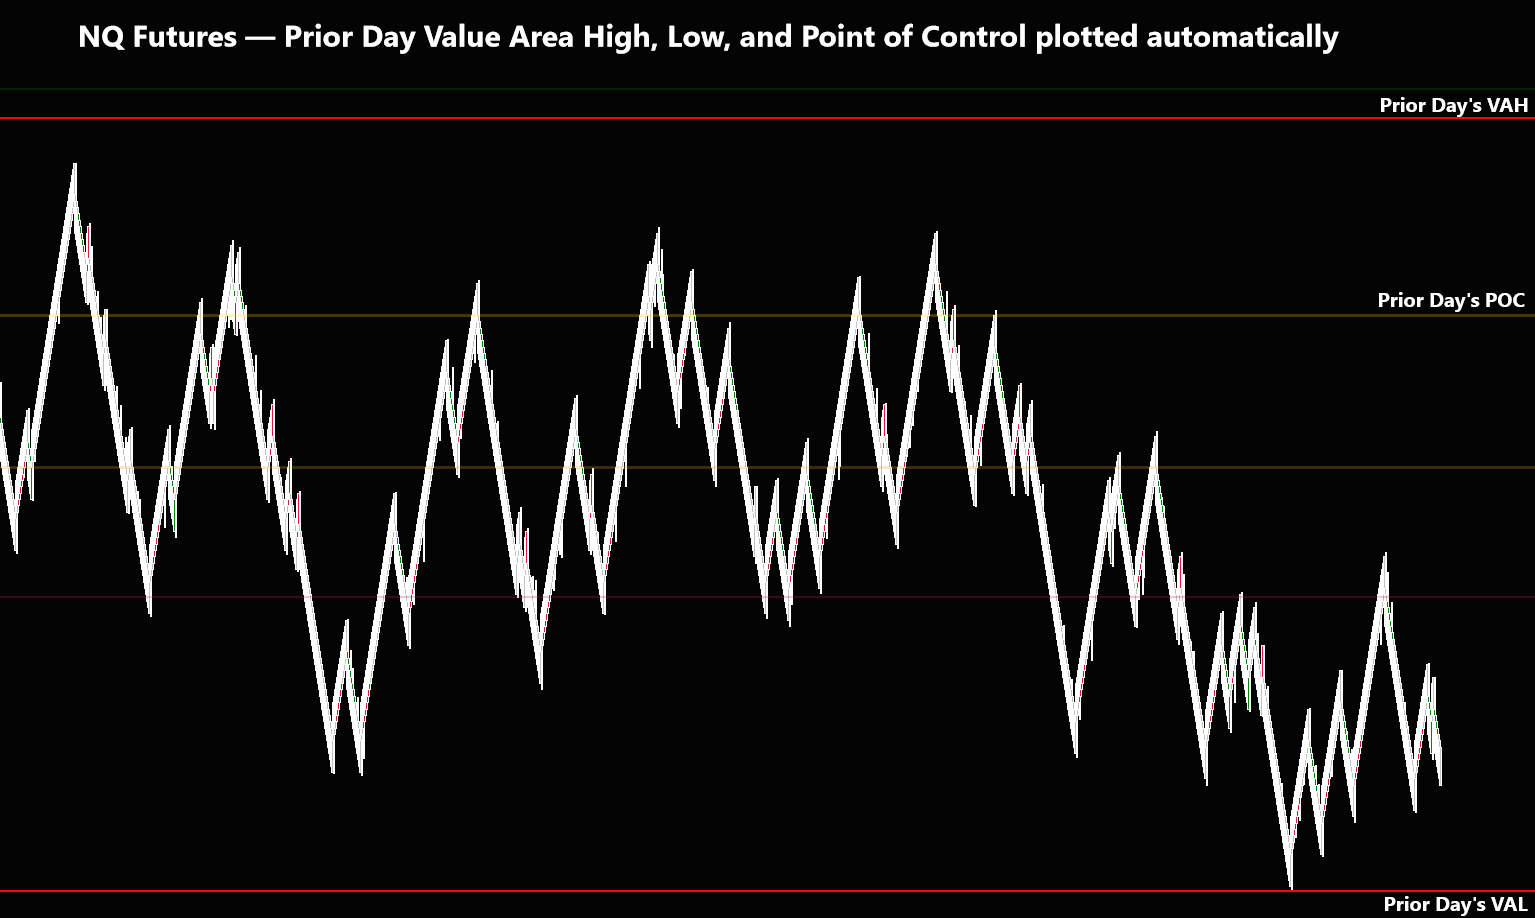
Volume Profile
The Prior day’s Volume Profile is a critical reference point. Value Area High and Value Area Low are key levels watched by the institutions and professional traders. Knowing that market participants are accepting or rejecting the prior day’s value is crucial to understanding the current day’s market environment.
Live trading daily in our Discord
Access to all our NinjaTrader, Markers Plus & Predator X templates and trading models
Full indicator support
Trading tips, instructional PDFs, videos
Statistical rollups each week for primary setups; statistical profile available
Training sessions four times a week
Our focus is on trading models with a statistical edge; money management based on statistical profiles; proper use of leverage or risk management
Vibrant trading community
Participate in new programs; options and pairs trading
The Reverse Mullet
The First Pullback Nobody Sees Coming The Reverse Mullet is a deep NQ intraday pullback setup built on a real anomaly — one that reverses the logic of an established methodology. Also, after the NQ sets a new high or low for the day, this is often the best trade on the board. The indicator marks it automatically — so you never miss it.
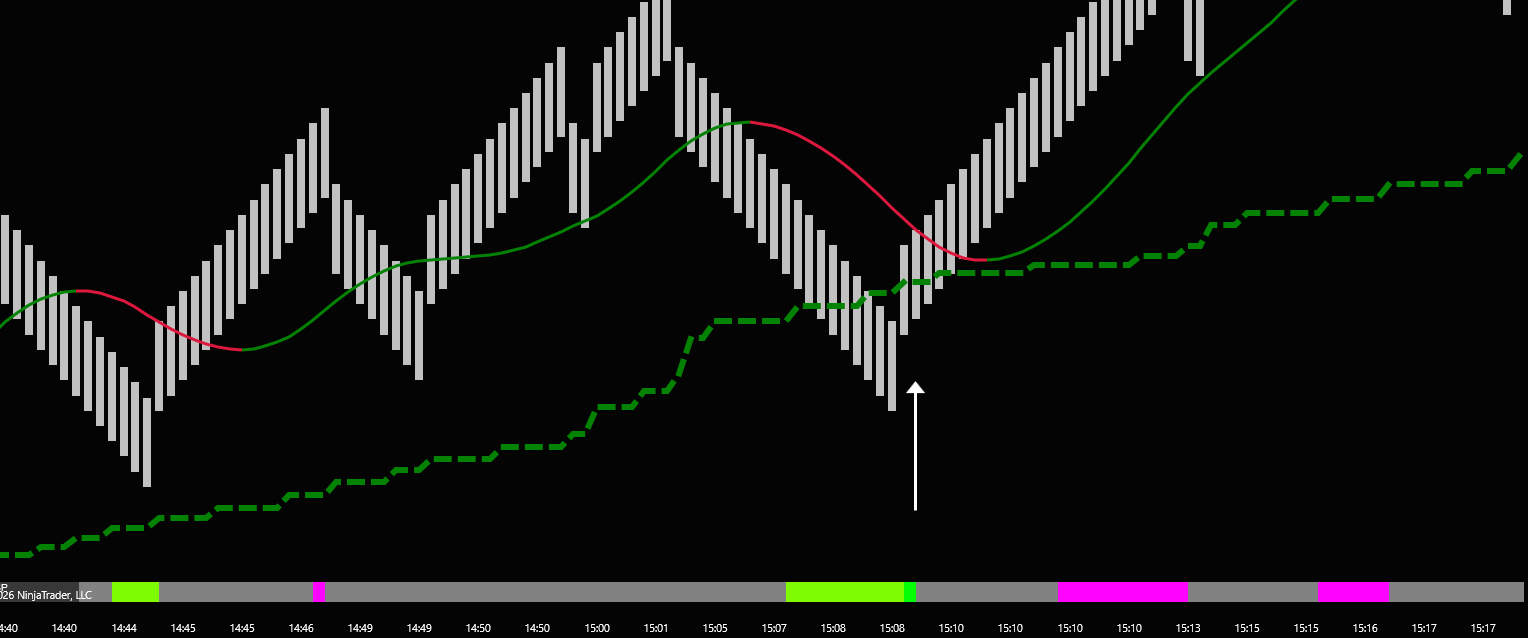
The Puncture Trade
Most traders guess where a pullback will end. The Puncture Trade doesn't guess — it waits. Our proprietary CenterLine defines the exact level where a trending market needs to prove itself. Price pulls back, punctures the CenterLine, reverses — and the trade is on. This is the highest reward-to-risk setup in our trading model arsenal.
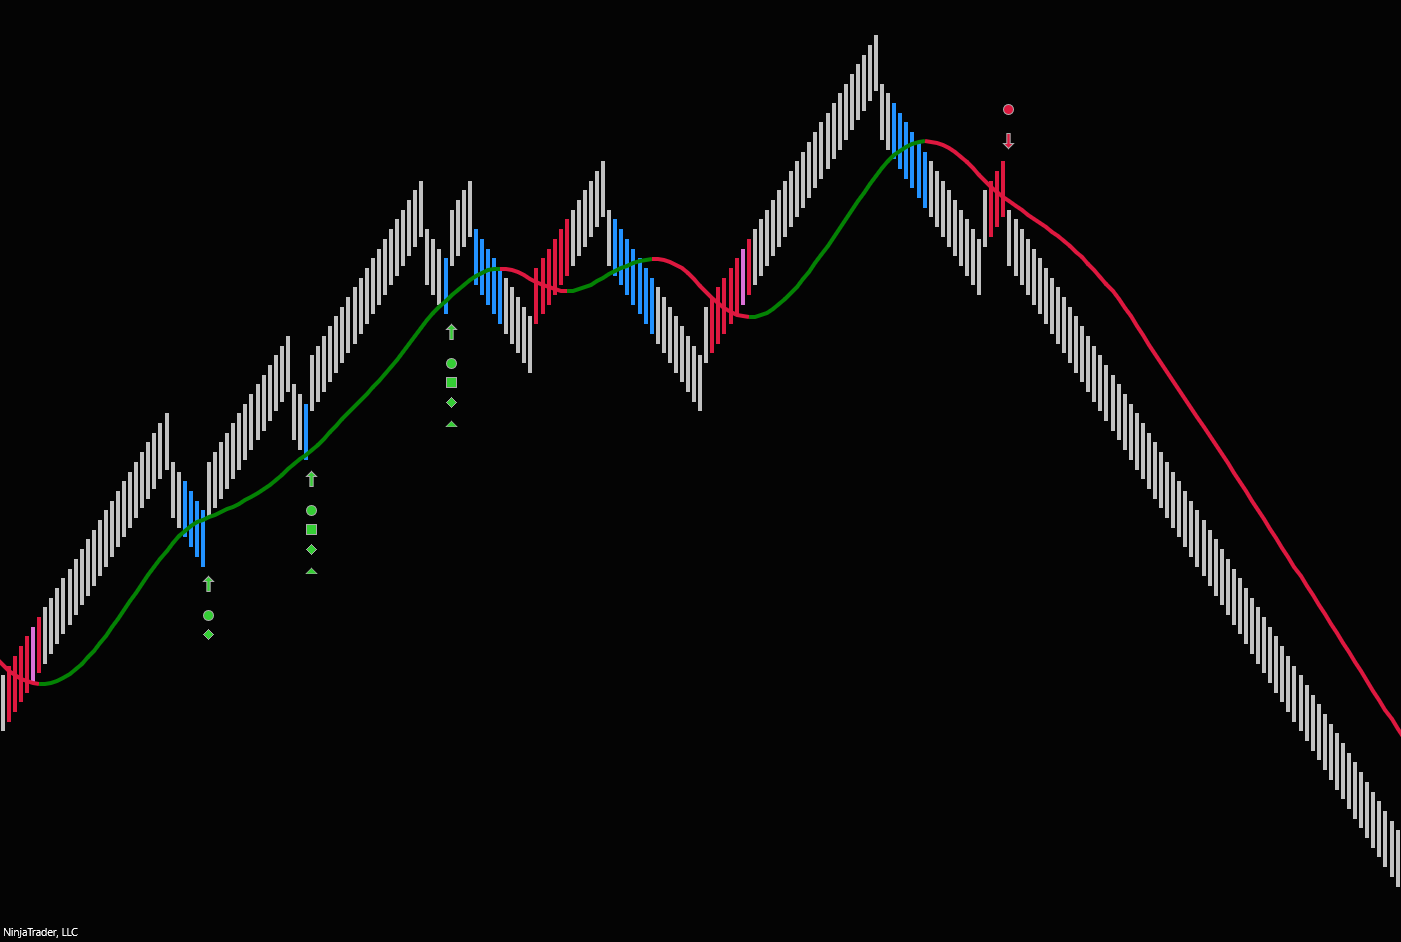
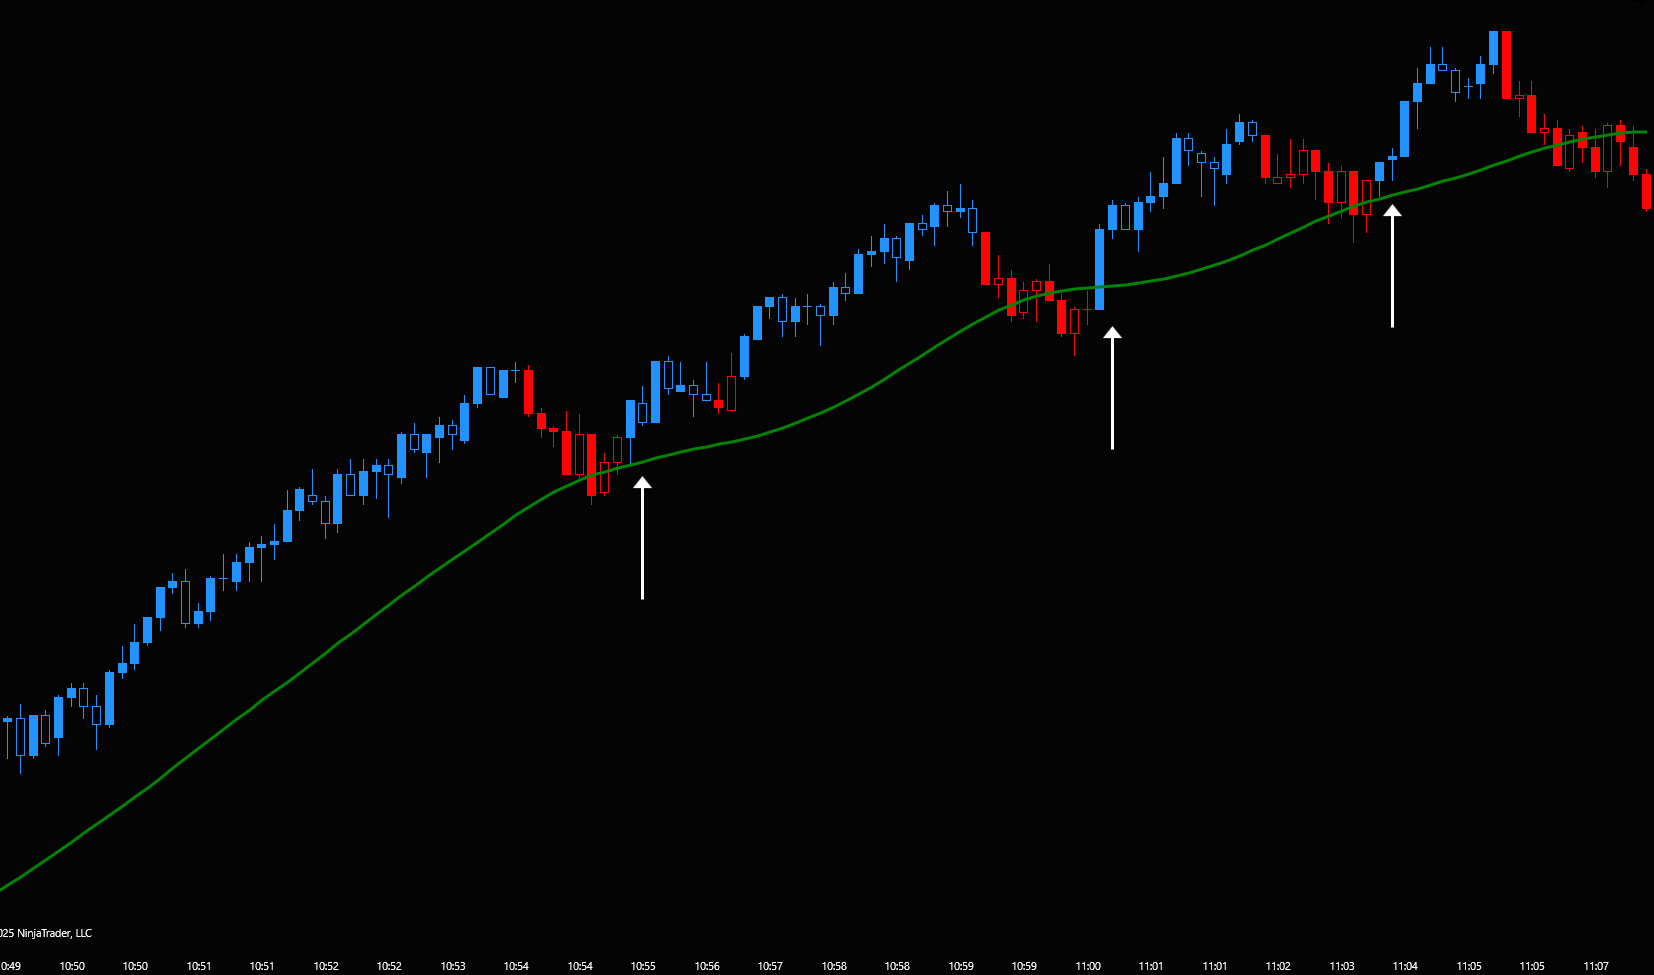
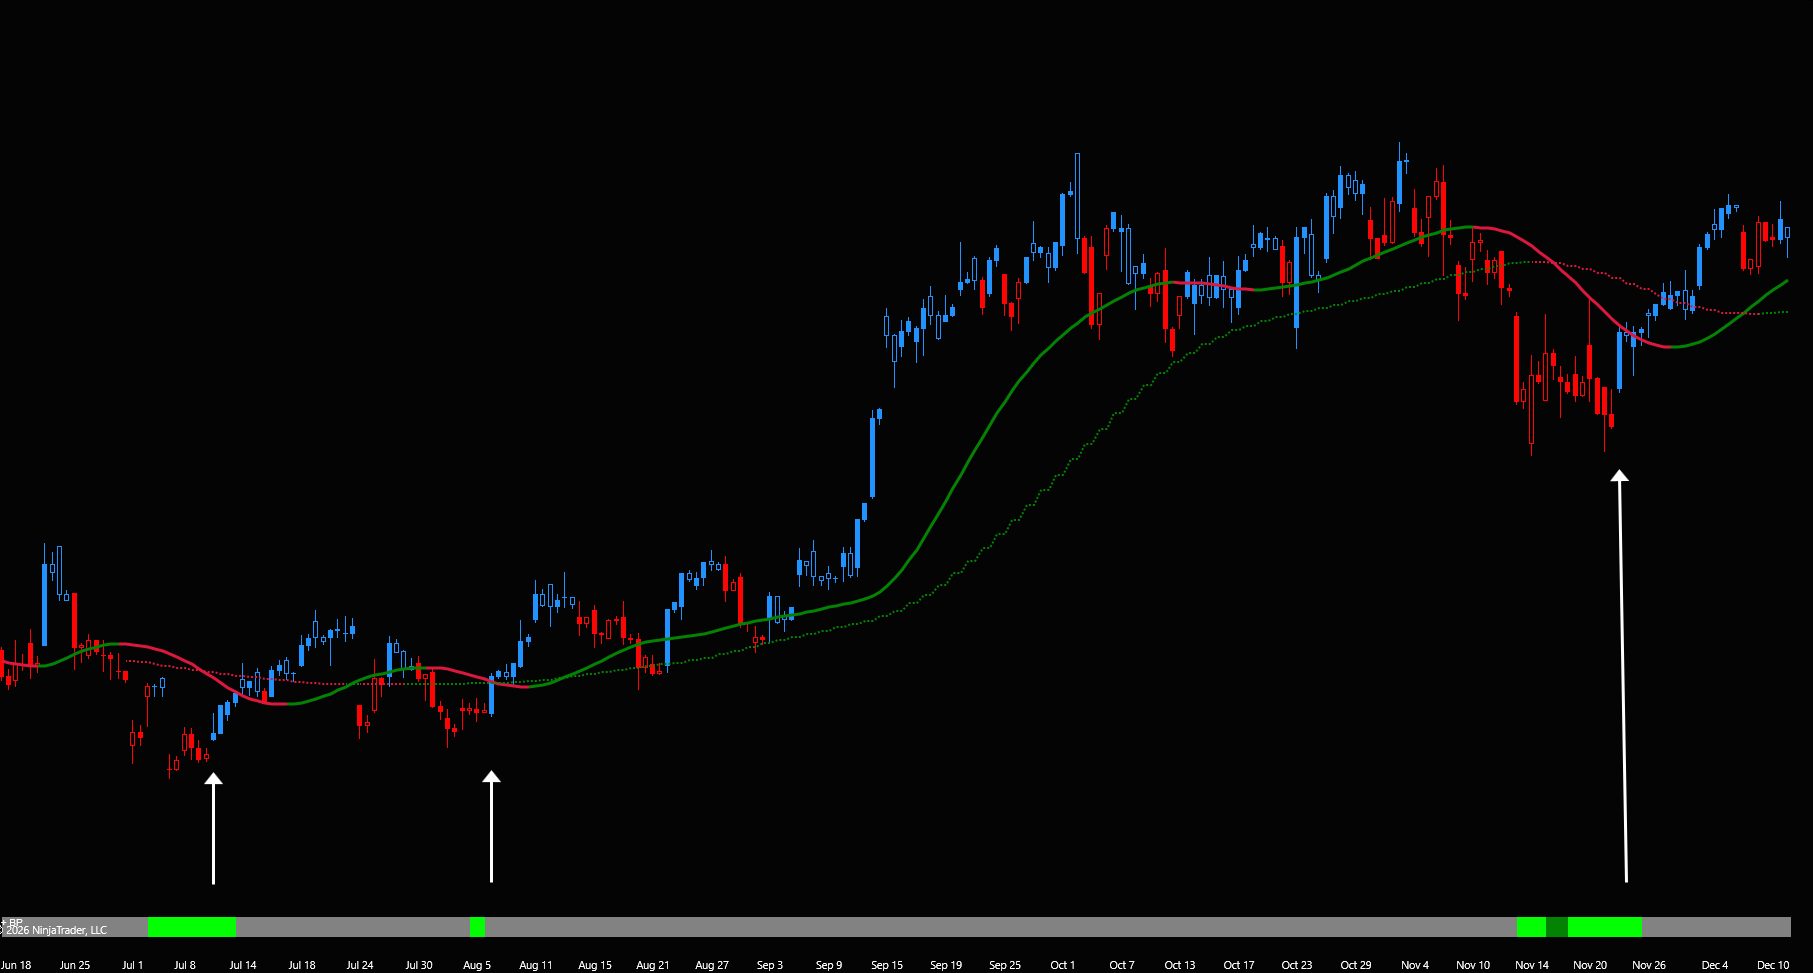
Trading Model
The CenterLine Method
for time, tick, range-bar, and Heiken Ashi charts
The foundation of everything at A+ Setups. The CenterLine Method has anchored a swing trading program for over 15 years. It pairs the proprietary CenterLine Trend Indicator with GHL ColorBars to define market conditions with visual clarity — bullish, bearish, or transitional. No interpretation required.
Works on any chart type and any timeframe. Weekly swing trades down to intraday seconds.
Key Features
Developed for NinjaTrader
CenterLine Indicator comes with the following:
CenterLine trend indicator and GHL ColorBars
Feature to allow plotting a higher time frame CenterLine trend indicator on the lower time frame chart
Selectable option to plot arrows at potential entry points
Option to change colors of trend indicator and GHL ColorBars to suit user’s preference
333 Tick Chart; MNQ futures
Indicators
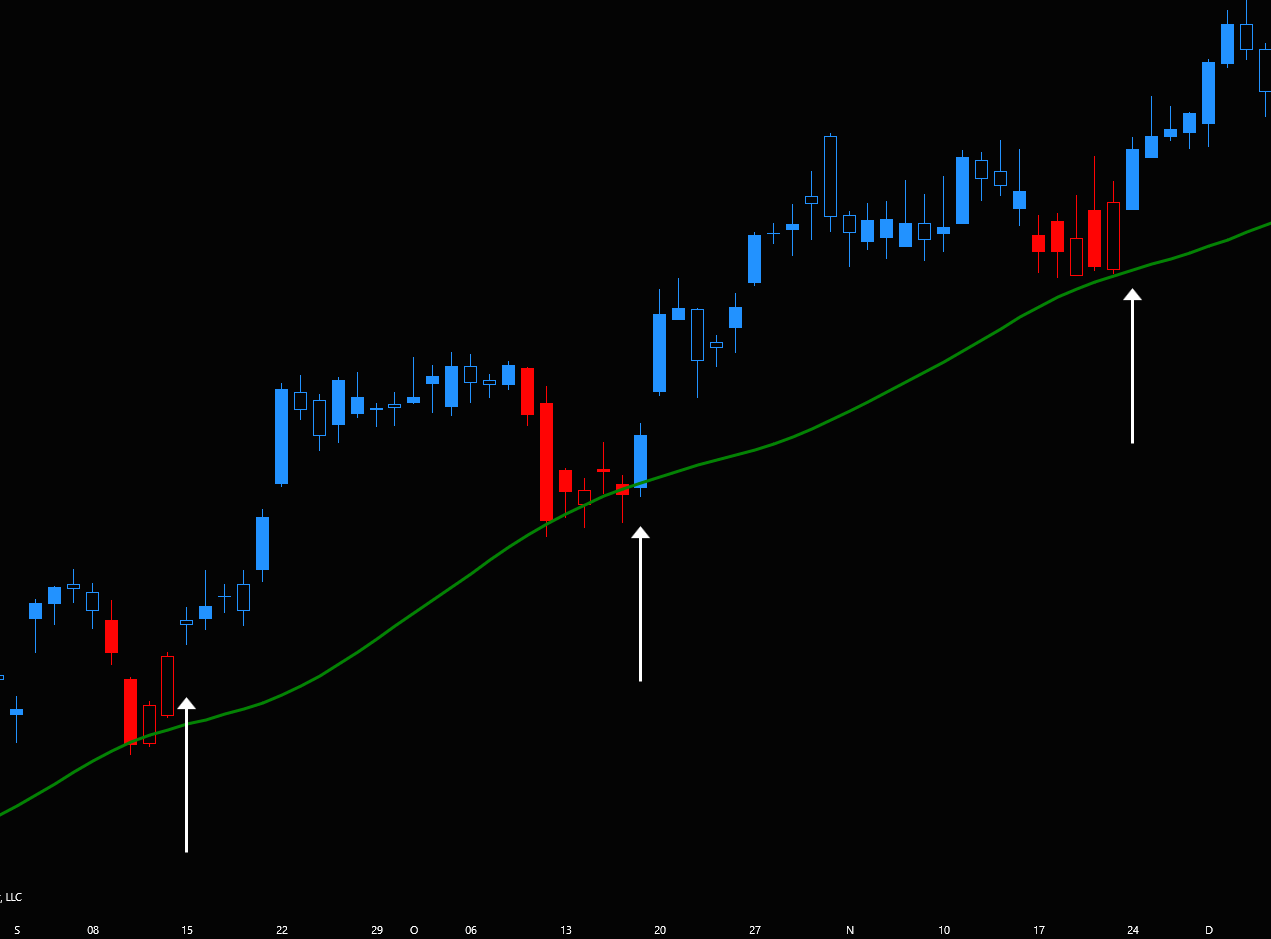
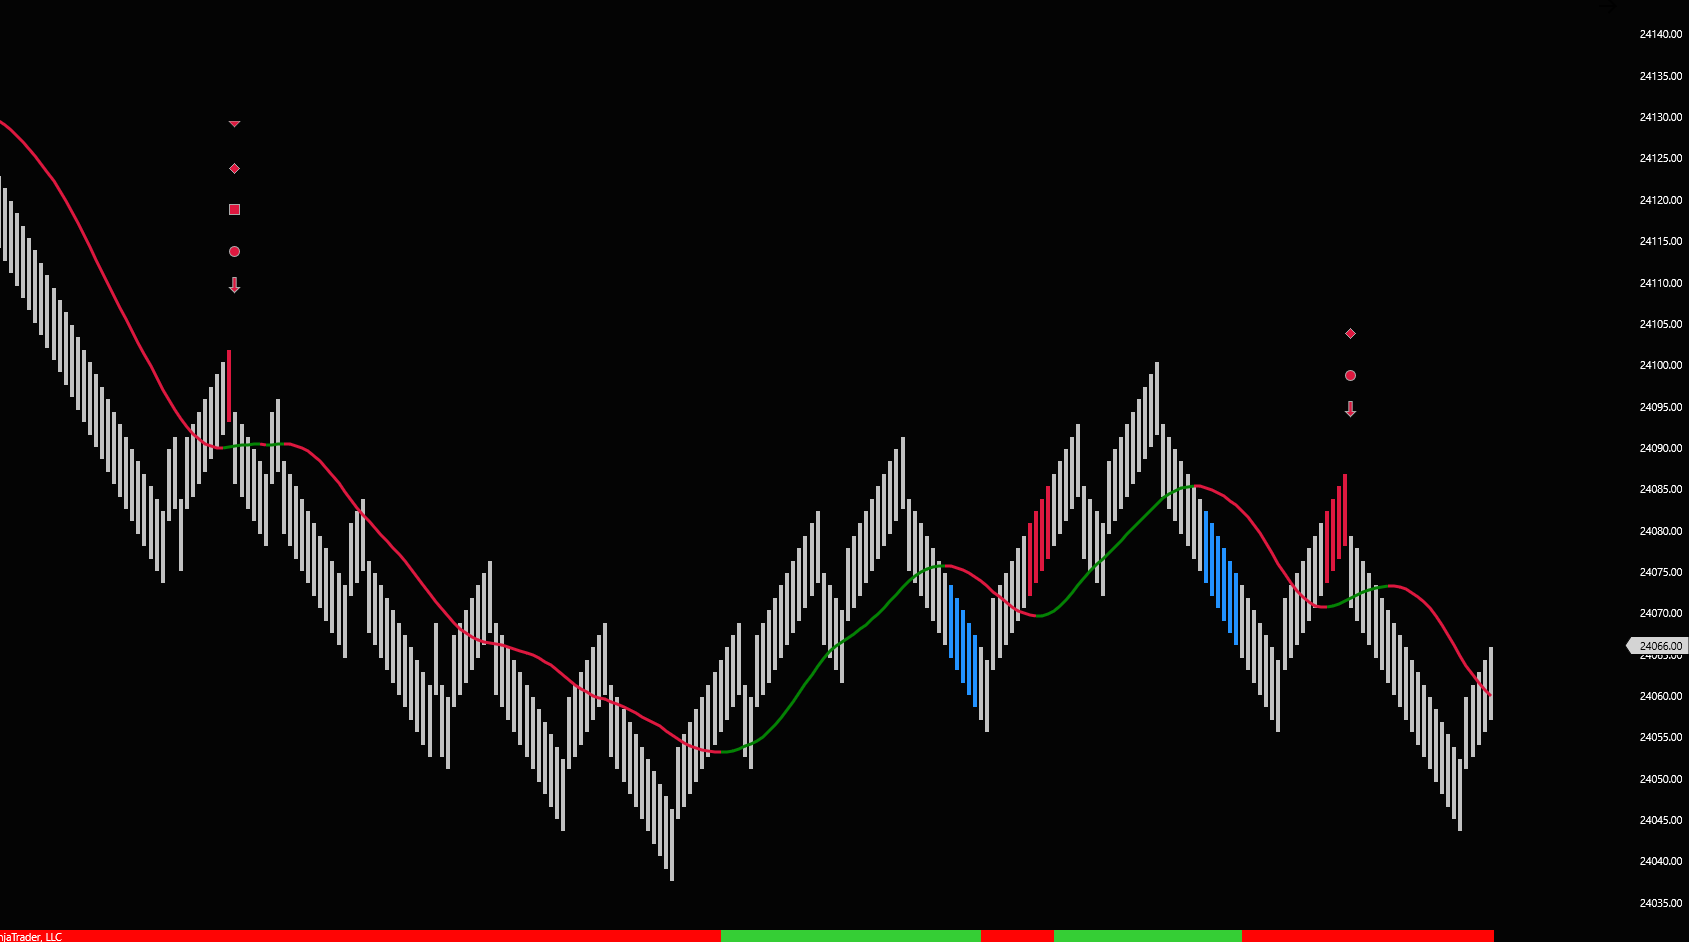
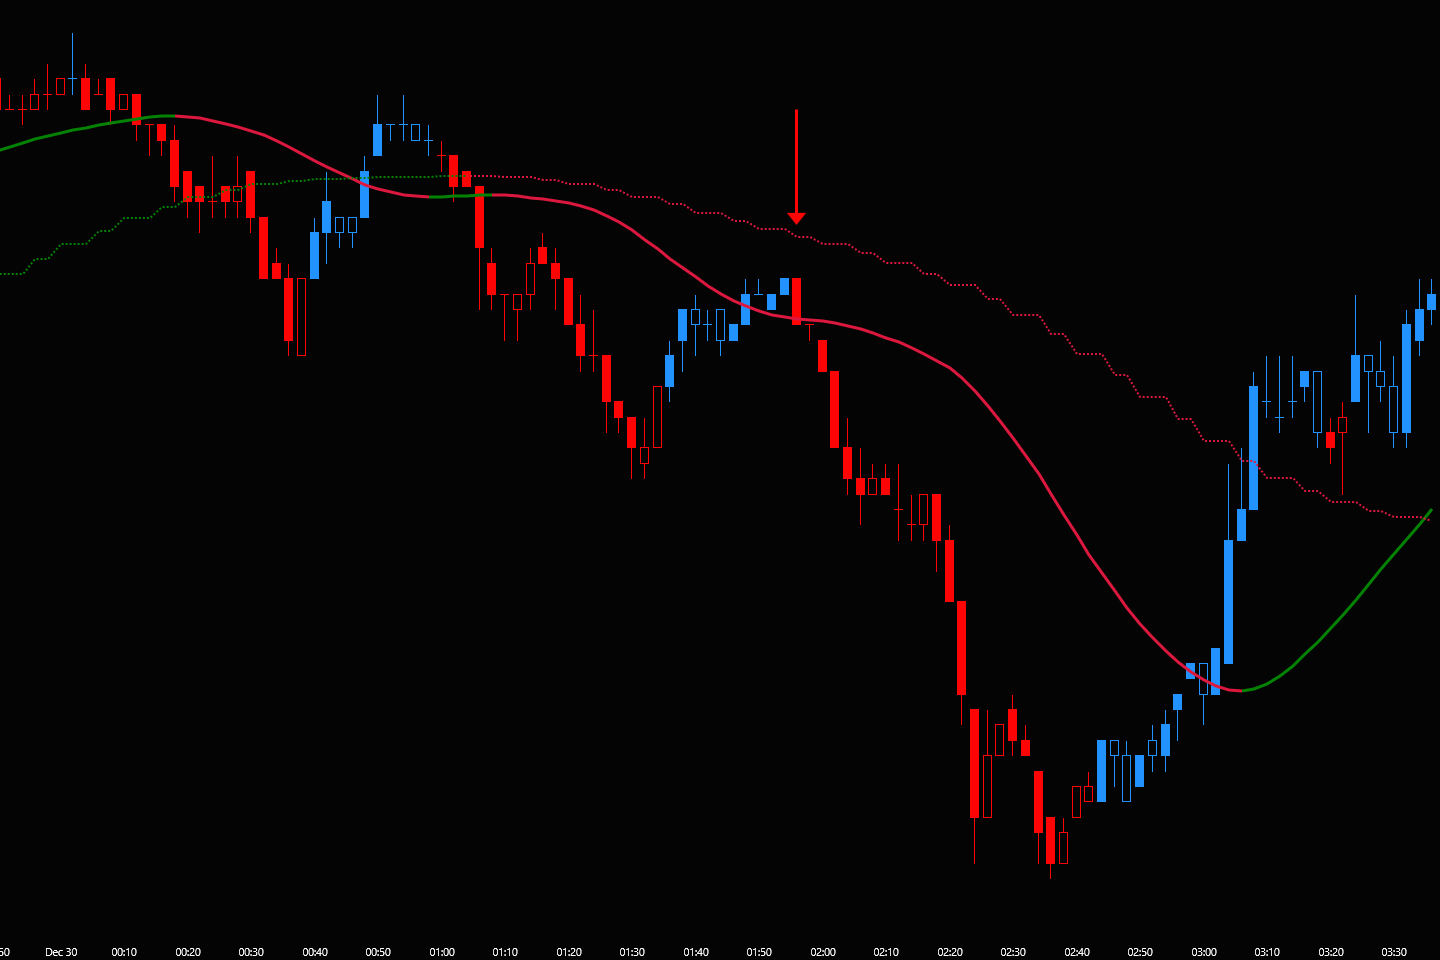
The Top / Bottom Picker
The Top/Bottom Picker is an indicator combo that has been used for over a decade in a live swing trading program. It identifies intermediate-term tops and bottoms with precision — turning Lime Green at potential lows and Magenta at potential highs, directly on the chart.
Works on any timeframe. No interpretation required.
Daily Chart TSLA — Bottom Picker signals multiple bottoms
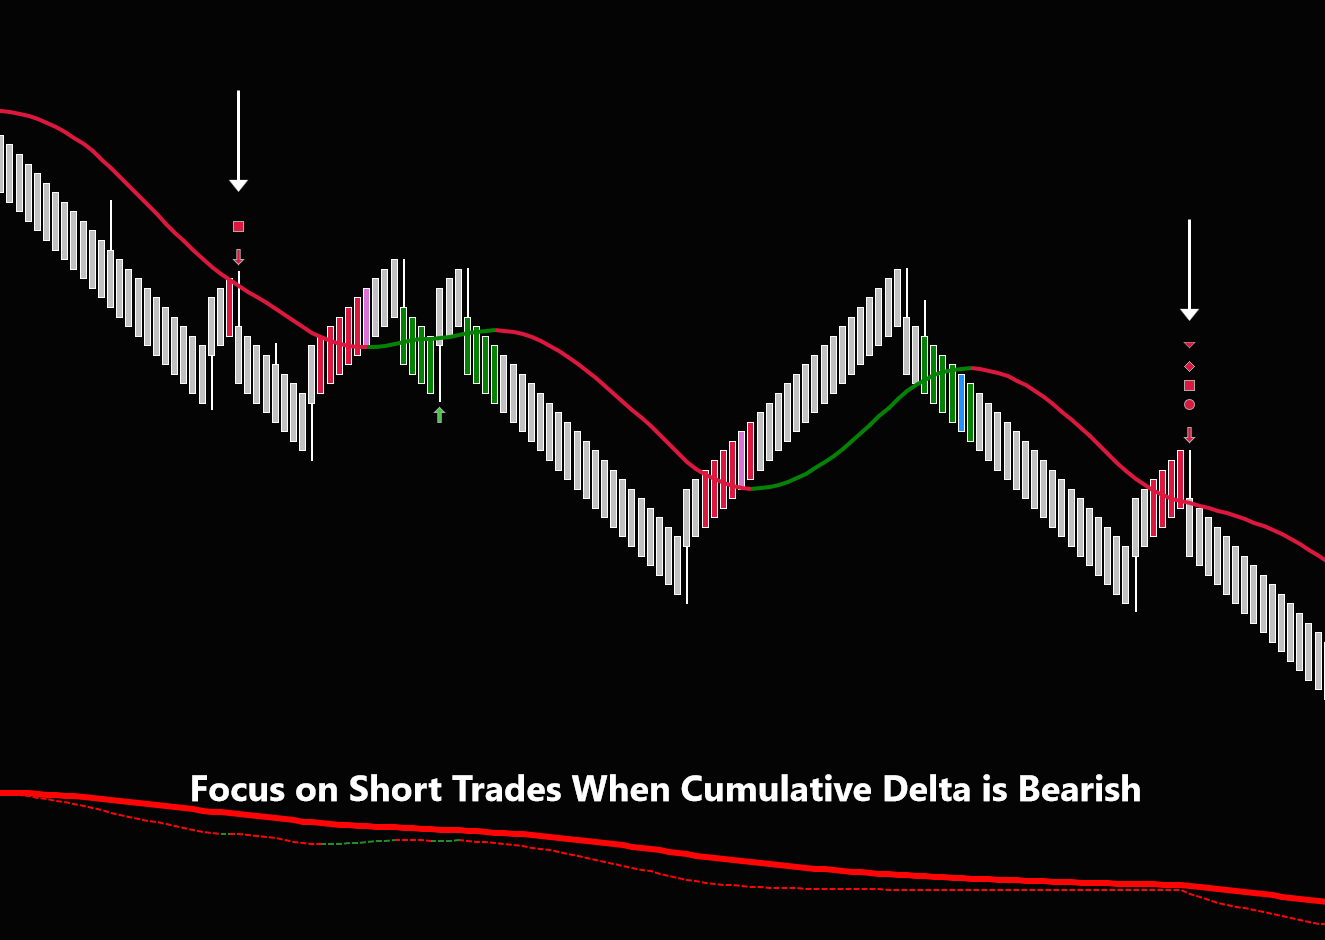
Cumulative Delta Filtering
The Cumulative Delta (CD) Indicator reveals the true balance between buying and selling pressure in real-time. It tracks the net difference between market buys and sells, accumulating throughout the session to show which side is in control.
Positive CD confirms buying dominance. Negative CD confirms selling dominance. Use it as a filter — trade long when price pulls back in an uptrend and CD stays positive. Trade short when price rallies in a downtrend and CD stays negative.
A simple, powerful confirmation tool that keeps you aligned with order flow.
No guessing — Cumulative Delta filtering keeps you short
S-Levels
Pricing
All Trading Models and indicators are Free in June!
With a subscription to A+ Setups
$35.99 / mo
Perfect for traders who want:
Use code 5EC72 for 5% off 1st Month!
2 Minute Chart; ES futures
Daily Chart; AAPL